The Signal · From the workshop
Ask Your Data, and show your working
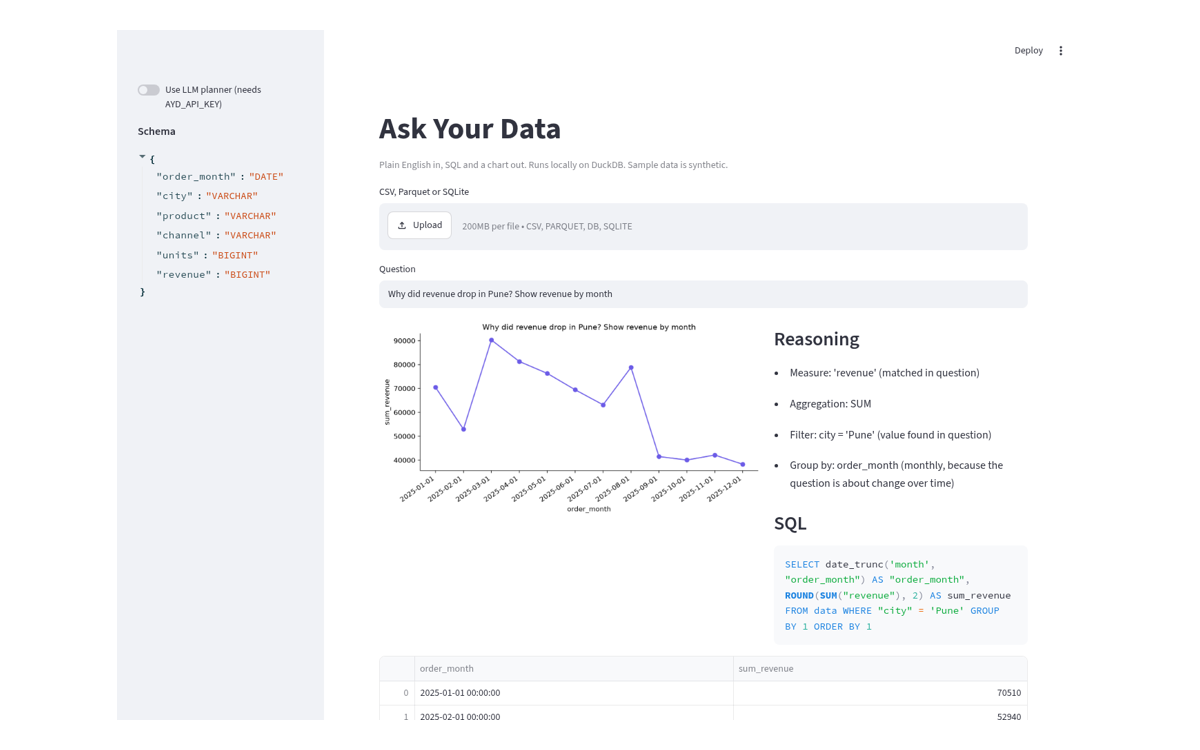
Plain English in, SQL and a chart out, running locally on DuckDB. It works with no API key, and it always shows the query it ran.
This is a project I built. Code is MIT-licensed and open for review.
What it is
Ask Your Data answers questions like “why did revenue drop in Pune?” about a CSV, Parquet or SQLite file. A transparent rule-based planner works fully offline. It handles totals, averages, counts, groupings, filters, monthly trends and top-N questions. You can plug in any OpenAI-compatible model for harder questions, and it falls back to the rules if the model fails. Every answer shows its reasoning, the SQL, a table and a chart, through a command line or a small Streamlit app.
Why it matters
Most analytics questions in a business are simple, and the slow part is waiting for someone to write the query. But a tool that answers without showing its working teaches people to trust numbers they cannot check. Here the SQL is always visible, only read-only queries are allowed, and the data stays on your machine unless you choose a remote model.
Honest caveats
The sample dataset is synthetic: 576 rows with a planted drop in Pune, so the demo has something to find. The rule planner handles one table and a fixed set of phrasings. Anything beyond that needs the optional LLM planner, which I have not benchmarked. It is an early version, not a product.
Try it
Code, tests and quickstart: github.com/Shashwat-Kumar/ask-your-data. Issues and pull requests are welcome.